Have you ever wondered which cities in the United States have the worst air quality? Or, which cities have the cleanest air? The American Lung Association’s (ALA) annual report removes the guesswork and provides those exact answers. Aptly titled “State of the Air,” the report analyzes and summarizes official air quality data. And while there are many necessary improvements for better full-scale air quality monitoring, the ALA’s “State of the Air” provides a helpful air quality snapshot for the nation.
American Lung Association’s State of the Air
First published in 2000, the ALA’s State of the Air is an annual report summarizing air quality for the previous few years. (For example–the 2021 report is based on air quality data from 2017-2019.) To provide ranked lists of the worst and best air quality locations, researchers analyze ozone, long-term particle pollution and short-term particle pollution numbers. The report then provides city, state and county-based grades based on the three measurements.
Why these pollutants specifically? As criteria pollutants, ozone and particle pollution (also known as particulate matter) are both widespread, hazardous to the environment and human health and monitored across the nation by the Environmental Protection Agency (EPA). The ALA uses official EPA air quality data to track and average the pollutant levels. Based on the measurements, the ALA then assigns grades to the data and ranks both regions across America.
Over the past 20 years, the State of the Air reports have resulted in both cause for optimism and pessimism. It illustrates the many successes of the 1970 Clean Air Act in reducing emissions, but also conveys that air pollution is still a very present threat. In fact, this year’s report found that 40% of Americans are still breathing polluted air on a regular basis.
State of the Air 2021
First and foremost … the full report is available for all to access! You can search the data by zip code, state, county or city (that is for larger metropolitan areas). Make sure to try it out and find the state of your local air quality. There are a couple key findings in this year’s report.
Looking at the Numbers
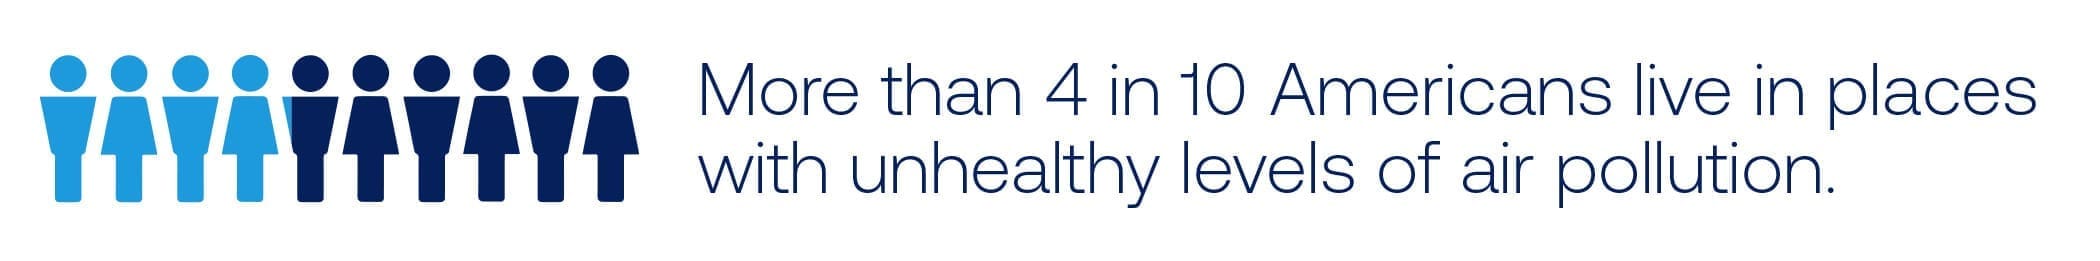
- Four in 10 Americans live in areas that received at least one “F” air quality grade. That’s 135 million people across 217 counties who are living with unhealthy levels of ozone or particle pollution (or both!).
- 20.7 million Americans live in areas that failed all three measurements. Of that 20.7 million, 14 million are people of color.
- People of color are 61% more likely to live in a county with a failing grade compared to white people.
Unequal Air Quality & Risk
Specific populations are at a greater risk from air pollution exposure and poor air quality. This includes: those living in poverty and lower-income populations, children, elderly, people of color, smokers and those with preexisting health conditions or respiratory illnesses including asthma, COPD and cancer. Notably, people of color are three times as likely to live in high pollution regions.
COVID-19’s Impact
The pandemic highlighted discrepancies in air quality and the many difficulties of air pollution. New research shows that greater air pollution exposure relates to more severe COVID-19 cases and outcomes.
Future Challenges
The report also unveils some of the difficult upcoming challenges for air quality. Specifically, that climate change has and will continue to have a large impact on air pollution, especially as more wildfires and higher overall outdoor temperatures increases ozone and particle pollution levels.
2021’s Most Polluted & Cleanest Cities
The year’s most polluted cities are all on the West Coast, aligning with the fact that higher temperatures and more direct sunlight produces more ozone days. It also portrays Alaska’s particularly difficult wildfire season and the impact wildfires has on air quality.
- Ozone Pollution: Los Angeles-Long Beach, California
- Short-Term Particle Pollution: Fairbanks, Alaska
- Year-Round Particle Pollution: Bakersfield, California
The cleanest cities are not ranked in the way most polluted cities are. Rather, simply making the cleanest air list for any of the three measurements is a win. All cities listed as a clean air city received the same grade, thus without rank. There were however five cities or regions across the country that made it onto the clean air list for all three categories:
- Burlington, Vermont
- Charlottesville, Virginia
- Elmira-Corning, New York
- Honolulu, Hawaii
- Wilmington, North Carolina
Understanding Ozone & Particle Pollution
Ozone
The worst areas for ozone pollution are in the west and southwest regions. This is likely due to the process of ground-level ozone formation. It forms when chemicals come into contact with sunlight, producing chemical reactions. Therefore, higher temperatures and direct sunlight are key to ground-level ozone formation. California as a state has the most cities and/or counties in the top 25 worse ozone exposure areas in the 2021 report.
Ozone presents a serious health threat. It is considered a respiratory system irritant. Symptoms include coughing, wheezing, shortness of breath, contributes to the development of asthma and COPD, long-term lung damage and premature death.
Short-Term Particle Pollution
Short-term particle pollution, or the 24-hour measurements also largely spike in western and southwestern regions due to excessive heat and wildfires. Significant particle pollution sources include: wildfires, wood burning of any kind (stoves, fireplaces, fire pits, etc.), diesel vehicles and other motor equipment as well as industrial sources. Particle pollution, also known as particulate matter, is a mixture of many different materials in solid and liquid form. They also vary in size. Smaller or finer particles are more dangerous for human health because they can penetrate deeper into the lungs.
Annual Particle Pollution
Similar to both ozone and short-term particle pollution, the majority of 2021’s top 25 annual particle pollution levels are western and southwestern areas. However, also on the list are cities with higher power plant emissions such as notable midwestern industrial cities.
Clean Air At Home
So, what can you actually do with this information? The answer is … a lot! In order to improve air quality, you first have to be aware of air quality. And that goes for both outside and inside air quality. To intervene locally, it means knowing your city, county, or even state air quality averages. With data and trends, you’ll be able to better determine the larger regional risks and what sort of solutions to advocate for.
It’s a similar process for improving indoor air quality. Except–you actually have control over the air you breathe in your home. To emphasize, that is a key difference. If your county consistently fails safe ozone levels, it’s important to check the air quality index before outdoor activities. If your city suffers from high annual particle pollution levels, upgrading to higher-efficiency air filters is a smart step. Or, if you’re looking for a whole-home solution, mechanical ventilation limits the impact outdoor air has on your indoor space!
And while actively monitoring outdoor air pollution levels is important for health and home quality, you can also monitor indoor air quality. The first step to clean air at home is knowing what the problems are. An in-duct central air monitor tracks air pollutants throughout the entire home and analyzes for trends. If you think “State of the Air” offers helpful insight, you’ll love data specific to your living space!
What Is the State of Your Air?
Find out the state of your air quality thanks to the ALA’s annual report and data analysis! Many Americans continue to breathe unhealthy air. You can choose to take action and create healthier air indoors via IAQ upgrades and solutions and advocate for greater air quality regulations–indoors and out.